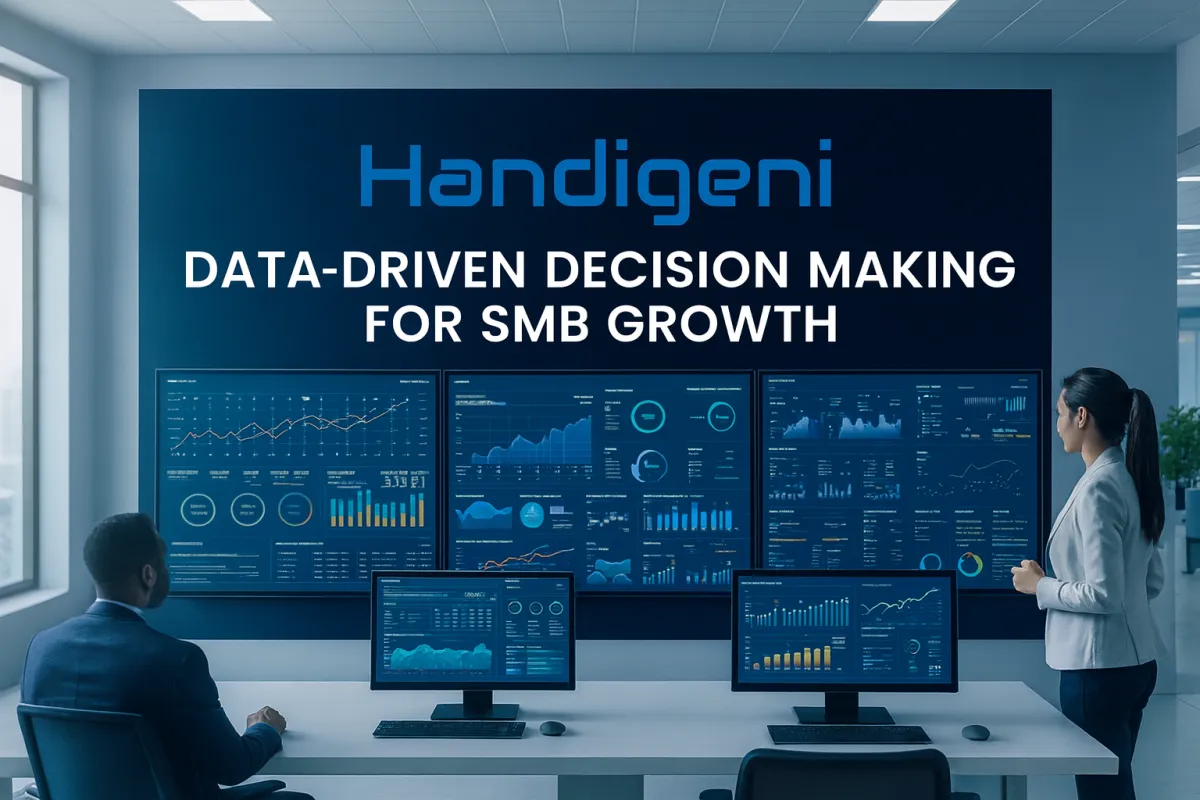
Handigeni: Analytics Dashboards for Data-Driven Decisions
Data-Driven Success: Analytics Dashboards That Transform Business Decisions
Published by Handigeni | Business Intelligence & AI Growth Solutions
Category: Business Analytics, SMB Growth Strategies
In today's competitive business landscape, successful SMBs don't just collect data—they transform it into actionable insights that drive revenue growth, optimize operations, and create sustainable competitive advantages. The difference between thriving businesses and those that struggle often comes down to one critical factor: their ability to make data-driven decisions quickly and accurately.
The Hidden Crisis: Data Overwhelm in Small and Medium Businesses
Small and medium businesses today generate more data than ever before. Customer interactions, sales transactions, marketing campaigns, operational metrics, and financial records create an overwhelming flood of information. Yet, despite having access to all this data, 73% of SMBs report that they struggle to extract meaningful insights from their business information.
This data paralysis creates several critical problems:
Decision Delays: Business owners spend hours manually compiling reports instead of making strategic decisions
Missed Opportunities: Important trends and patterns go unnoticed in spreadsheets and disconnected systems
Resource Waste: Teams duplicate efforts and pursue ineffective strategies due to lack of visibility
Competitive Disadvantage: Slower response times to market changes and customer needs
The Cost of Poor Data Management
SMBs lose an average of $1.2 million annuallydue to inefficient data management and delayed decision-making processes.
Traditional approaches to business analytics—spreadsheets, manual reporting, and disconnected tools—simply cannot keep pace with modern business demands. SMBs need sophisticated yet accessible analytics solutions that provide real-time insights without requiring a dedicated data science team.
The Game-Changer: Real-Time Analytics Dashboards
Modern analytics dashboards represent a fundamental shift from reactive to proactive business management. Instead of discovering problems after they've impacted your bottom line, real-time dashboards provide instant visibility into every aspect of your business performance.
What Makes Analytics Dashboards Essential for SMB Growth
Instant Visibility: Real-time dashboards eliminate the delay between business events and awareness. When a marketing campaign starts generating leads, when sales velocity changes, or when customer satisfaction scores shift, you know immediately—not weeks later when monthly reports are compiled.
Unified Business Intelligence: Rather than juggling multiple systems and reports, analytics dashboards consolidate all critical business metrics into a single, coherent view. Sales data, marketing performance, customer behavior, operational efficiency, and financial metrics work together to tell your complete business story.
Predictive Insights: Advanced analytics dashboards don't just show what happened—they indicate what's likely to happen next. Trend analysis, forecasting, and predictive modeling help SMBs anticipate challenges and capitalize on opportunities before competitors even recognize them.

Key Analytics Features That Drive Measurable Business Growth
Customer Acquisition Analytics
Understanding your customer acquisition process is fundamental to sustainable growth. Advanced analytics dashboards provide detailed visibility into:
Lead Source Performance: Which marketing channels generate the highest quality prospects
Conversion Rate Optimization: Where prospects drop off in your sales funnel and why
Customer Acquisition Cost (CAC): The true cost of acquiring customers through each channel
Lead Scoring and Qualification: Automated ranking of prospects based on conversion probability
Revenue Analytics and Forecasting
Predictable revenue is the foundation of business growth. Analytics dashboards provide sophisticated revenue tracking including:
Sales Pipeline Velocity: How quickly deals move through each stage
Revenue Attribution: Which marketing efforts directly contribute to closed deals
Seasonal Trend Analysis: Identifying patterns that help optimize resource allocation
Recurring Revenue Tracking: Monitoring subscription growth and churn rates
Operational Efficiency Metrics
Efficient operations directly impact profitability. Key operational analytics include:
Process Automation ROI: Measuring the impact of automated workflows
Team Productivity Analytics: Individual and departmental performance metrics
Resource Utilization: Optimizing tool usage and eliminating waste
Customer Service Performance: Response times, resolution rates, and satisfaction scores
ROI Tracking and Performance Optimization: Turning Data into Dollars
The ultimate value of analytics dashboards lies in their ability to directly improve business profitability. Effective ROI tracking transforms abstract data points into concrete financial insights that drive strategic decisions.
Marketing ROI Optimization
Marketing represents one of the largest discretionary expenses for most SMBs. Analytics dashboards provide precise attribution tracking that shows:
Campaign Performance: Which specific marketing initiatives generate positive ROI
Channel Effectiveness: The lifetime value generated by each marketing channel
Budget Optimization: Automatic recommendations for reallocating marketing spend
A/B Testing Results: Data-driven optimization of messaging, targeting, and timing
Marketing Analytics Impact
SMBs using advanced marketing analytics see an average 32% improvement in marketing ROI within the first six months of implementation.
Sales Performance Analytics
Sales analytics go beyond tracking revenue to provide actionable insights for sales optimization:
Individual Sales Rep Performance: Identifying top performers and coaching opportunities
Deal Analysis: Understanding why certain deals close and others don't
Quota Management: Realistic goal setting based on historical performance and market conditions
Customer Segmentation: Tailoring sales approaches to different customer types
Operational Cost Management
Analytics dashboards reveal hidden costs and inefficiencies throughout business operations:
Process Cost Analysis: The true cost of manual versus automated processes
Vendor Performance Tracking: ROI analysis of external service providers
Employee Productivity Metrics: Identifying training needs and optimization opportunities
Technology ROI: Measuring the business impact of software investments
Industry Statistics: The Competitive Advantage of Data-Driven SMBs
The business case for advanced analytics becomes clear when examining industry performance data:
SMB Analytics Adoption Results
• 67% faster decision-making compared to manual reporting
• 23% increase in annual revenue within 18 months
• 41% reduction in operational costs through optimization insights
• 56% improvement in customer retention rates
Market Leadership: Companies that extensively use analytics are twice as likely to be in the top quartile of financial performance within their industries. This advantage becomes even more pronounced for SMBs, where agility and responsiveness create significant competitive differentiation.
Customer Experience Excellence: Data-driven SMBs deliver superior customer experiences because they understand customer behavior, preferences, and pain points at a granular level. This translates to higher customer lifetime values and stronger word-of-mouth marketing.
Scalability and Growth: Analytics dashboards provide the foundation for sustainable growth by identifying what works, what doesn't, and where opportunities exist. SMBs can scale successful strategies while avoiding costly mistakes.

How Handigeni's Analytics Transform SMB Operations
Handigeni's AI-powered analytics dashboard represents the next generation of business intelligence for small and medium businesses. Unlike traditional analytics tools that require extensive technical expertise, Handigeni provides enterprise-level insights through an intuitive, user-friendly interface designed specifically for SMB needs.
Unified Business Intelligence Platform
Handigeni integrates data from all business systems—CRM, marketing automation, sales pipelines, customer service, and financial systems—into a single, coherent analytics environment. This eliminates the data silos that prevent many SMBs from achieving comprehensive business insights.
AI-Powered Insights and Recommendations
Beyond displaying data, Handigeni's AI engine analyzes patterns, identifies trends, and provides specific recommendations for business optimization. The system learns from your business performance and continuously improves its accuracy and relevance.
Real-Time Performance Monitoring
Handigeni's dashboards update in real-time, providing immediate visibility into:
Live Lead Generation: Track marketing campaign performance as it happens
Sales Pipeline Movement: Monitor deal progression and identify bottlenecks instantly
Customer Satisfaction Metrics: Receive immediate alerts when satisfaction scores change
Financial Performance: Track revenue, expenses, and profitability in real-time
Automated Reporting and Alerts
Handigeni eliminates manual reporting by automatically generating comprehensive business reports and sending intelligent alerts when important metrics change. This ensures that critical business events never go unnoticed.
Economic Benefits and Measurable Business Value
Implementing Handigeni's analytics solution delivers quantifiable economic benefits that extend far beyond improved reporting capabilities.
Direct Cost Savings
Reduced Manual Labor: Eliminate 15-20 hours per week of manual report generation
Improved Decision Speed: Make strategic decisions 67% faster with instant access to relevant data
Optimized Marketing Spend: Reduce wasted marketing budget by 25-40% through precise attribution tracking
Enhanced Sales Efficiency: Increase sales productivity by 30% through better lead prioritization
Revenue Growth Opportunities
Customer Lifetime Value Optimization: Increase CLV by 35% through better retention strategies
Cross-Selling and Upselling: Identify additional revenue opportunities worth 15-25% of existing revenue
Market Expansion: Use data insights to identify and capture new market segments
Pricing Optimization: Data-driven pricing strategies that improve margins without losing customers

Handigeni Analytics ROI
Average SMBs see $4.20 return for every $1.00 invested in Handigeni's analytics platform within the first 12 months.
Risk Mitigation and Strategic Planning
Analytics dashboards help SMBs avoid costly mistakes and identify risks before they impact business performance:
Early Warning Systems: Identify declining performance trends before they become critical
Cash Flow Management: Predict and prepare for seasonal fluctuations in revenue
Competitive Intelligence: Monitor market changes and competitive threats
Strategic Planning: Use historical data and predictive analytics for long-term planning
Implementation Strategy: From Setup to Success
Successful analytics implementation requires a strategic approach that balances technical capabilities with business objectives. Handigeni's implementation methodology ensures that SMBs realize value quickly while building sustainable analytics capabilities.
Phase 1: Foundation and Integration (Weeks 1-2)
The implementation process begins with comprehensive data integration and system setup:
Data Source Identification: Catalog all existing business systems and data sources
Integration Planning: Design data flow architecture that ensures comprehensive coverage
Dashboard Configuration: Customize analytics interfaces to match business priorities
User Access Setup: Establish appropriate permissions and access controls
Phase 2: Customization and Training (Weeks 3-4)
Once the technical foundation is established, focus shifts to business-specific optimization:
KPI Definition: Identify and configure the most important business metrics
Report Customization: Create automated reports that match existing business processes
Alert Configuration: Set up intelligent notifications for critical business events
Team Training: Ensure all users understand how to access and interpret analytics
Phase 3: Optimization and Expansion (Weeks 5-8)
The final implementation phase focuses on maximizing value and expanding analytics capabilities:
Performance Analysis: Evaluate initial results and identify optimization opportunities
Advanced Feature Activation: Enable predictive analytics and AI-powered recommendations
Process Integration: Incorporate analytics into daily business operations and decision-making
Continuous Improvement: Establish ongoing optimization and expansion plans
Ongoing Support and Evolution
Handigeni provides comprehensive ongoing support to ensure continuous value realization:
Regular Performance Reviews: Quarterly assessments of analytics ROI and optimization opportunities
Feature Updates: Automatic access to new analytics capabilities and AI improvements
Strategic Consulting: Expert guidance on leveraging analytics for business growth
Technical Support: Responsive assistance for any technical issues or questions
Transform Your Business with Data-Driven Intelligence
Stop making business decisions based on incomplete information and gut feelings. Handigeni's AI-powered analytics dashboard provides the real-time insights and predictive intelligence your SMB needs to compete and win in today's market.
Schedule your free analytics consultation today and discover how data-driven decision-making can transform your business performance, increase profitability, and accelerate growth.
During your consultation, our analytics experts will:
Assess your current data management challenges
Demonstrate Handigeni's analytics capabilities with your business scenarios
Provide a customized ROI projection for your specific situation
Design an implementation plan that minimizes disruption and maximizes value
Ready to unlock the power of your business data?
Contact Handigeni today and take the first step toward data-driven success.
Tags: Analytics Dashboard Business Intelligence ROI Tracking Data-Driven Decisions SMB Analytics Performance Optimization Real-Time Insights Business Growth Handigeni AI-Powered Analytics
